echarts柱状图固定宽度设置、柱状之间的间距
 六月初
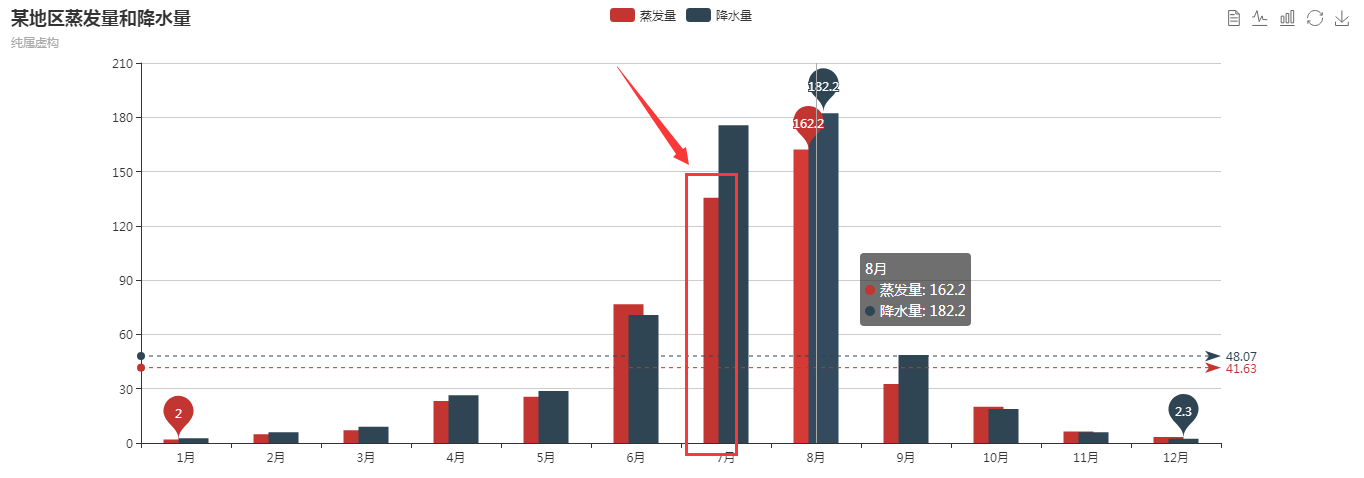
六月初效果预览:
问题描述:实现柱与柱之间的间距设置、设置柱状图的宽度!
实现方式:在series设置barWidth(宽度设置)和barGap(间距设置)
barWidth:柱条的宽度;默认自适应,也可设置成相对于类目宽度的百分比及固定值。
barGap:不同系列的柱间距离;默认当前柱条宽度的30%;也可设置成固定值及百分比;下方例子中,设置为-50%,呈现效果如上图所示,柱图之间一半被重叠
上图完整代码:
<!DOCTYPE html>
<html>
    <head>
        <meta charset="UTF-8">
        <title></title>
        <script src="https://cdn.staticfile.org/echarts/4.2.0-rc.2/echarts.min.js"></script>
    </head>
    <body>
        <div id="test" style="height: 500px;width: 100%;">

        </div>
        <script>
            var BarBOX1 = echarts.init(document.getElementById("test"));
            option = {
			    title : {
			        text: '某地区蒸发量和降水量',
			        subtext: '纯属虚构'
			    },
			    tooltip : {
			        trigger: 'axis'
			    },
			    legend: {
			        data:['蒸发量','降水量']
			    },
			    toolbox: {
			        show : true,
			        feature : {
			            dataView : {show: true, readOnly: false},
			            magicType : {show: true, type: ['line', 'bar']},
			            restore : {show: true},
			            saveAsImage : {show: true}
			        }
			    },
			    calculable : true,
			    xAxis : [
			        {
			            type : 'category',
			            data : ['1月','2月','3月','4月','5月','6月','7月','8月','9月','10月','11月','12月']
			        }
			    ],
			    yAxis : [
			        {
			            type : 'value'
			        }
			    ],
			    series : [
			        {
			            name:'蒸发量',
			            type:'bar',
			            barWidth : 30,//柱图宽度
			            barGap:'-50%',//柱图间距
			            data:[2.0, 4.9, 7.0, 23.2, 25.6, 76.7, 135.6, 162.2, 32.6, 20.0, 6.4, 3.3],
			            markPoint : {
			                data : [
			                    {type : 'max', name: '最大值'},
			                    {type : 'min', name: '最小值'}
			                ]
			            },
			            markLine : {
			                data : [
			                    {type : 'average', name: '平均值'}
			                ]
			            }
			        },
			        {
			            name:'降水量',
			            type:'bar',
			            barWidth : 30,//柱图宽度
			            data:[2.6, 5.9, 9.0, 26.4, 28.7, 70.7, 175.6, 182.2, 48.7, 18.8, 6.0, 2.3],
			            markPoint : {
			                data : [
			                    {name : '年最高', value : 182.2, xAxis: 7, yAxis: 183},
			                    {name : '年最低', value : 2.3, xAxis: 11, yAxis: 3}
			                ]
			            },
			            markLine : {
			                data : [
			                    {type : 'average', name : '平均值'}
			                ]
			            }
			        }
			    ]
			};
            BarBOX1.setOption(option);
        </script>
    </body>
</html>
echarts柱状图固定宽度设置、柱状之间的间距!
 六月初字帖坊小程序
你想要的字帖模板及工具,这里都有!
六月初字帖坊小程序
你想要的字帖模板及工具,这里都有!
815篇文章
67782人已阅读