echarts改变柱状图Y轴、X轴字体颜色,坐标线颜色
 六月初
六月初echarts实现更改坐标轴线颜色、XY坐标轴字体颜色设置:
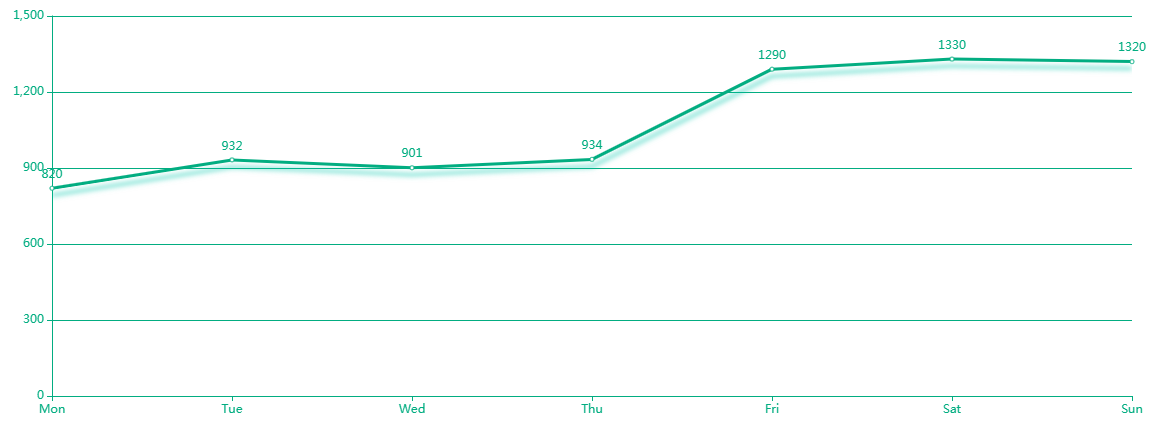
效果预览:
关键代码:
splitLine: {
	lineStyle: {
		// 使用深浅的间隔色
		color: ['#02ad81']
	}
},
nameTextStyle: {
	color: ['#02ad81']
},
axisLine: {
	lineStyle: {
		color: '#02ad81',
	}
}
完整代码:
<!DOCTYPE html>
<html>
	<head>
		<meta charset="UTF-8">
		<title></title>
		<script src="https://cdn.staticfile.org/echarts/4.2.0-rc.2/echarts.min.js"></script>
	</head>
	<body>
		<div id="test" style="height: 500px;width: 100%;"></div>
		<script>
			var BarBOX1 = echarts.init(document.getElementById("test"));
			option = {
				color: ['#02ad81', '#bbe2e8', '#6cacde'],
				xAxis: {
					type: 'category',
					boundaryGap: false,
					data: ['Mon', 'Tue', 'Wed', 'Thu', 'Fri', 'Sat', 'Sun'],
					splitLine: {
						lineStyle: {
							// 使用深浅的间隔色
							color: ['#02ad81']
						}
					},
					nameTextStyle: {
						color: ['#02ad81']
					},
					axisLine: {
						lineStyle: {
							color: '#02ad81',
						}
					}
				},
				yAxis: {
					type: 'value',
					splitLine: {
						lineStyle: {
							// 使用深浅的间隔色
							color: ['#02ad81']
						}
					},
					nameTextStyle: {
						color: ['#02ad81']
					},
					axisLine: {
						lineStyle: {
							color: '#02ad81',
						}
					}

				},
				series: [{
					itemStyle: {
						normal: {
							label: {
								show: true
							}
						}
					}, //设置数值显示在折线点上方
					data: [820, 932, 901, 934, 1290, 1330, 1320],
					type: 'line',
					lineStyle: {
						normal: {
							width: 3,
							shadowColor: 'rgba(1,199,171,0.6)',
							shadowBlur: 7,
							shadowOffsetY: 7
						}
					},
				}]
			};
			BarBOX1.setOption(option);
		</script>
	</body>
</html>从完整示例中可以看出,主要对xAxis、yAxis里面的参数进行了设置。
 六月初字帖坊小程序
你想要的字帖模板及工具,这里都有!
六月初字帖坊小程序
你想要的字帖模板及工具,这里都有!
810篇文章
7585人已阅读