echarts柱状图柱子上点击事件,折线图折线点上点击事件
 六月初
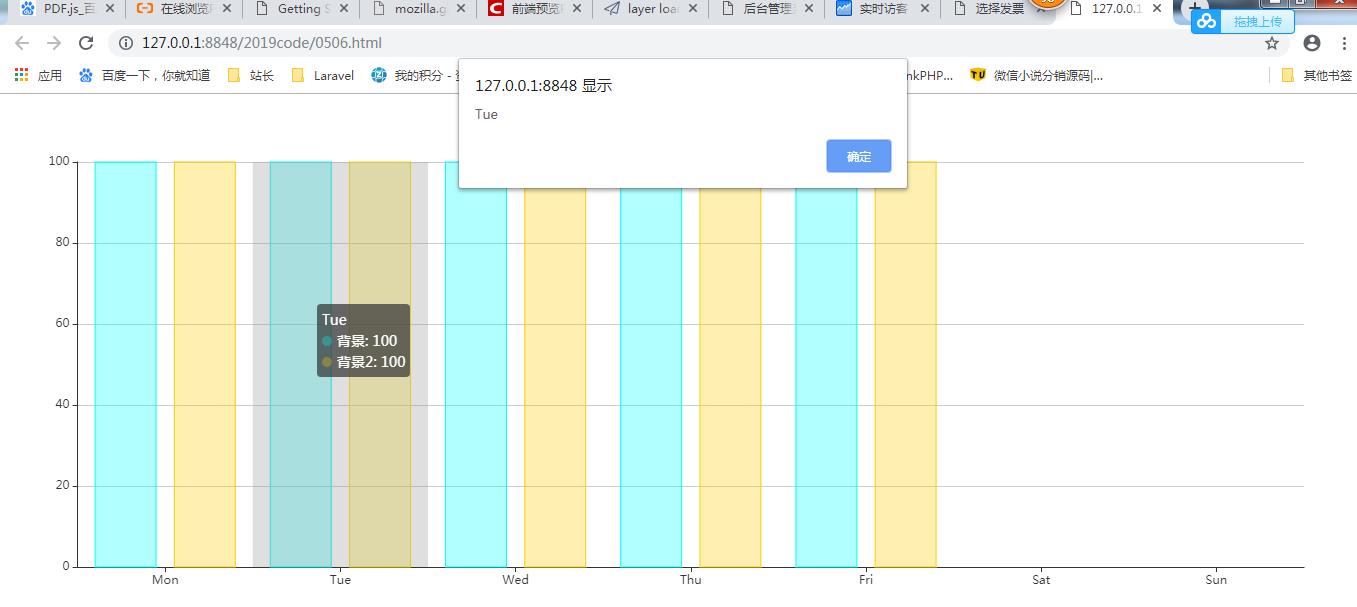
六月初echarts柱状图上柱子的点击事件,echarts折线点上的点击事件详细方法!
效果预览:
关键代码:
BarBOX1.on('click', function (params) {
	//为三个柱子设置点击事件
	var name = params.name;
	alert(name)
});
完整代码:
<!DOCTYPE html>
<html>
	<head>
		<meta charset="UTF-8">
		<title></title>
		<script src="https://cdn.staticfile.org/echarts/4.2.0-rc.2/echarts.min.js"></script>
	</head>
	<style>
		a{
			font-weight: bold;
		}
	</style>
	<body>
		<div id="test" style="height: 500px;width: 100%;"></div>
		<script>
			var BarBOX1 = echarts.init(document.getElementById("test"));
			option = {
				tooltip: {
					trigger: 'axis',
					axisPointer: { // 坐标轴指示器,坐标轴触发有效
						type: 'shadow' // 默认为直线,可选为:'line' | 'shadow'
					}
				},
				grid: {
					left: '3%',
					right: '4%',
					bottom: '3%',
					containLabel: true
				},
				xAxis: [{
					type: 'category',
					data: ['Mon', 'Tue', 'Wed', 'Thu', 'Fri', 'Sat', 'Sun'],
					axisTick: {
						alignWithLabel: true
					}
				}],
				yAxis: [{
					type: 'value'
				}],
				series: [{
						name: '背景',
						type: 'bar',
						data: [100, 100, 100, 100, 100, ],
						itemStyle: {
							normal: {
								color: 'rgba(0, 255, 255,.3)',
								borderColor: '#00ffff'
							}
						}
					},
					{
						name: '背景2',
						type: 'bar',
						data: [100, 100, 100, 100, 100, ],
						itemStyle: {
							normal: {
								color: 'rgba(255, 204, 0,.3)',
								borderColor: '#ffcc00'
							}
						}
					}
				]
			};
BarBOX1.on('click', function (params) {
	//为三个柱子设置点击事件
	var name = params.name;
	alert(name)
});
			BarBOX1.setOption(option);
		</script>
	</body>
</html>
注:折线图相同代码,点击折线点就可以弹出!
 六月初字帖坊小程序
你想要的字帖模板及工具,这里都有!
六月初字帖坊小程序
你想要的字帖模板及工具,这里都有!
819篇文章
3752人已阅读