uni-app中使用echarts兼容H5、微信小程序、APP三端
 六月初
六月初uni-app中使用echarts效果如图:
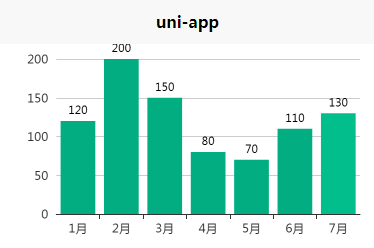
图形化数据生成柱状图,折线图等在uni-app插件库中实际有类似的组件,且兼容处理的很好能准确的兼容各个端口,如非必要个人建议还是使用官方推荐的组件《uCharts高性能跨全端图表》毕竟就兼容而已该插件确实做的很好,而对于使用习惯了echarts的用户可以继续参考本博客。
关于ucharts和echarts个人总结的优缺点
ucharts相对于echarts兼容算是最大的亮点,毕竟ucharts目前是有进行更新的这是很重要的一点。而echarts目前通用的兼容据说是个人开发者处理的兼容版本,目前貌似没有进行更新了。而且在本人的查找中并未找到一套代码兼容多个版本的处理,当然对每个版本的单独兼容处理是有github地址的《支付宝、微信小程序兼容版本》
echarts的个人觉得优势在于完整的文档,非常完善的需求文档,如阴影等各种效果在echarts中都可以找到对应的参数,而ucharts目前貌似对这些都还没有处理,个人查看评论大多数都是ucharts团队回答的自己去修改源码,或许后期ucharts对这些文档会慢慢进行更加详细的更新吧!
效果图vue文件中完整代码:
<template>
	<view class="content">
		<view style="height:400rpx;width:100%">
			<mpvue-echarts class="ec-canvas" @onInit="lineInit" canvasId="line" ref="lineChart" />
		</view>
	</view>
</template>

<script>
	import * as echarts from '@/components/echarts/echarts.simple.min.js';
	import mpvueEcharts from '@/components/mpvue-echarts/src/echarts.vue';
	let lineOption = {
		animation: true,
		color: ['#02ad81', '#bbe2e8', '#6cacde'],
		grid: {
			top: 15, //距离顶部15px
			bottom: '15%', //距离底部15%
			left: '15%',
			right: "4%"
		},
		calculable: false,
		xAxis: [{
			type: 'category',
			data: ['1月', '2月', '3月', '4月', '5月', '6月', '7月']
		}],
		yAxis: {
			type: 'value',
			axisLine: {
				show: false
			},
			axisTick: {
				show: false
			},
		},
		series: [{
			type: 'bar',
			data: [120, 200, 150, 80, 70, 110, 130],
			itemStyle: {
				normal: {
					label: {
						show: true, //开启显示
						position: 'top', //在上方显示
						textStyle: { //数值样式
							color: 'black',
							fontSize: 11
						}
					}
				}
			},
		}]
	};
	export default {
		data() {
			return {
				// echarts: echarts,
			}
		},
		onLoad() {

		},
		components: {
			mpvueEcharts
		},
		methods: {
			lineInit(e) {
				let {
					width,
					height
				} = e;
				let canvas = this.$refs.lineChart.canvas;
				echarts.setCanvasCreator(() => canvas);
				let lineChart = echarts.init(canvas, null, {
					width: width,
					height: height
				});
				canvas.setChart(lineChart);
				lineChart.setOption(lineOption);
				this.$refs.lineChart.setChart(lineChart);
			}
		},
	}
</script>

<style>
	.content {
		display: flex;
		flex-direction: column;
		align-items: center;
		justify-content: center;
	}

</style>本案例完整代码已上传码云《echatrs兼容微信小程序、APP、H5码云地址》
代码解析:通过import引入对应的vue组件,class和canvasId可以固定这么写,@onInit对应调用method中的方法。components定义组件的名称。
注意点:组件使用外部div需要设置宽度和高度,不然会引起echarts的宽高度为0,这样就可能造成页面中没有任何效果,实际上他是生效的,只是你没有设置宽高度。
 六月初字帖坊小程序
你想要的字帖模板及工具,这里都有!
六月初字帖坊小程序
你想要的字帖模板及工具,这里都有!
919篇文章
10362人已阅读