mapbox批量加载海量数据
地图开发
2022-08-22 14:55:40
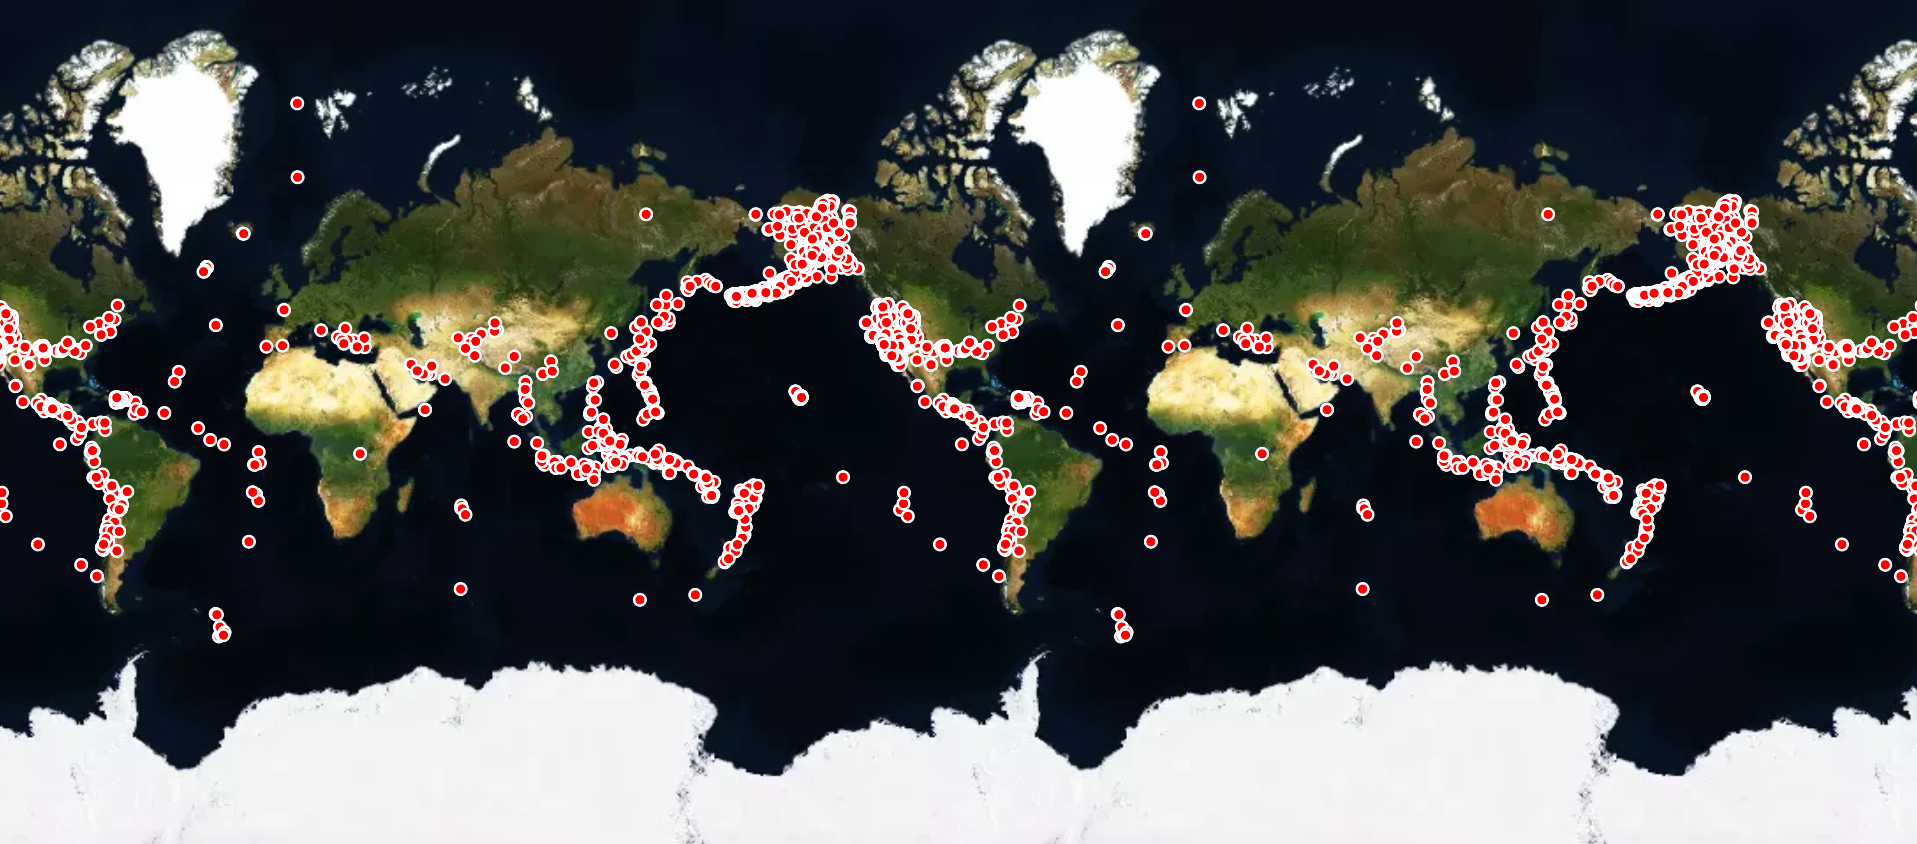
地图上海量点的展示,在实际项目中也算是一个非常常见的功能,那么在mapbox中我们要如何使用对应的api来开发出海量点的展示呢?
在mapbox地图中实现海量点展示,效果如图:

代码如下:
<!DOCTYPE html>
<html>
<head>
<meta charset="utf-8">
<title>Load data from an external GeoJSON file</title>
<meta name="viewport" content="initial-scale=1,maximum-scale=1,user-scalable=no">
<link href="https://api.mapbox.com/mapbox-gl-js/v2.9.2/mapbox-gl.css" rel="stylesheet">
<script src="https://api.mapbox.com/mapbox-gl-js/v2.9.2/mapbox-gl.js"></script>
<style>
body { margin: 0; padding: 0; }
#map { position: absolute; top: 0; bottom: 0; width: 100%; }
</style>
</head>
<body>
<div id="map"></div>

<script>
	mapboxgl.accessToken = 'pk.eyJ1Ijoic2l4YmxvZyIsImEiOiJjbDYxdjNxbTcwMzZ3M2ZwNzkzOWJqNTI5In0.o6rf1thO5EbTqa5gXOJKYA';
    const map = new mapboxgl.Map({
        container: 'map', // container ID
        style: 'mapbox://styles/mapbox/satellite-v9', // style URL
        zoom: 2, // starting zoom
        center: [108, 4], // // starting center in [lng, lat]
        // projection: 'globe' // display map as a 3D globe
    });

    map.on('style.load', () => {
        map.setFog({}); // enable atmosphere and stars
    });

    map.on('load', () => {
        map.addSource('earthquakes', {
            type: 'geojson',
            // Use a URL for the value for the `data` property.
            data: 'https://docs.mapbox.com/mapbox-gl-js/assets/earthquakes.geojson'
        });

        map.addLayer({
            'id': 'earthquakes-layer',
            'type': 'circle',
            'source': 'earthquakes',
            'paint': {
                'circle-radius': 4,
                'circle-stroke-width': 2,
                'circle-color': 'red',
                'circle-stroke-color': 'white'
            }
        });
    });
</script>

</body>
</html>
说明:开发中需要注意数据的格式。
经自己项目开发测试,至少对于几万个点的数据展示,使用该展示方式完全可以轻松应用。
 六月初字帖坊小程序
你想要的字帖模板及工具,这里都有!
913篇文章
3005人已阅读

 六月初
六月初