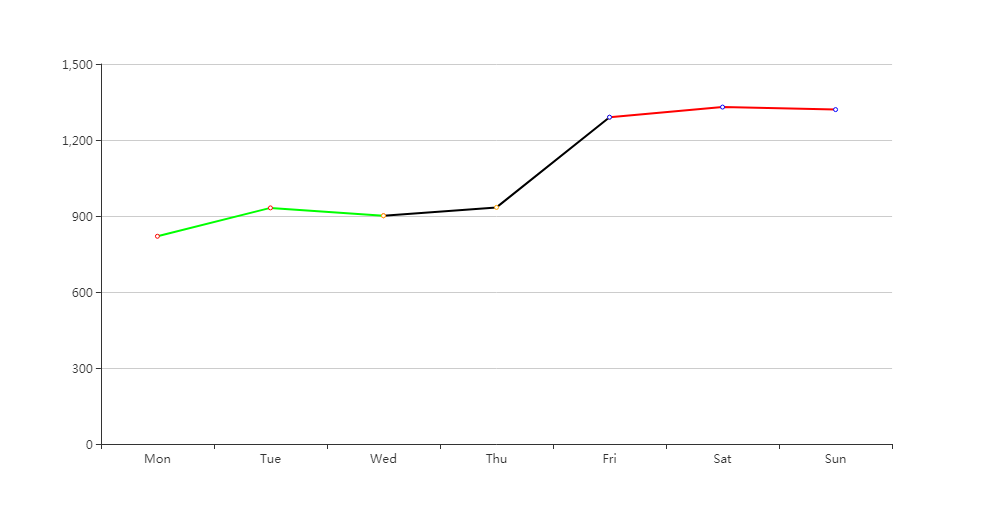
echarts折线图自定义折线颜色及自定义折线点颜色
Echarts
2019-01-21 11:24:44
效果预览:

实现代码:series中对应需要设置的折线点及线进行颜色设置。
itemStyle : {
    normal : {
        color:'orange',//折线点颜色
        lineStyle:{
            color:'#000'  //折线颜色
        }
    }
},
上图完整代码:
<!DOCTYPE html>
<html>
    <head>
        <meta charset="UTF-8">
        <title></title>
        <script src="https://cdn.staticfile.org/echarts/4.2.0-rc.2/echarts.min.js"></script>
        <script src="../canavs/jquery-1.8.3.min.js"></script>
    </head>
    <body>
        <div id="test" style="height: 500px;width: 100%;">

        </div>
        <div id="ids">

        </div>
        <script>
            var BarBOX1 = echarts.init(document.getElementById("test"));
            option = {
			    xAxis: {
			        type: 'category',
			        data: ['Mon', 'Tue', 'Wed', 'Thu', 'Fri', 'Sat', 'Sun']
			    },
			    yAxis: {
			        type: 'value'
			    },
			    series: [{
			        data: [820, 932,901, '-', '-','-','-'],
			        itemStyle : {
                        normal : {
                            color:'#f00',//折线点颜色
                            lineStyle:{
                                color:'#00FF00'  //折线颜色
                            }
                        }
                    },
			        type: 'line'
			    },{
			        data: ['-', '-', 901, 934, 1290, '-', '-'],
			        type: 'line',
				itemStyle : {
				    normal : {
				        color:'orange',//折线点颜色
				        lineStyle:{
				            color:'#000'  //折线颜色
				        }
				    }
				},
			    },
			    {
			        data: ['-', '-','-', '-', '1290', 1330, 1320],
			        type: 'line',
			        itemStyle : {
                        normal : {
                            color:'blue',//折线点颜色
                            lineStyle:{
                                color:'red'  //折线颜色
                            }
                        }
                    },
			    }]
			};
            BarBOX1.setOption(option);

        </script>
    </body>
</html>
结语:关于echarts更多的设置,大家可以去echarts进行查看设置!
 六月初字帖坊小程序
你想要的字帖模板及工具,这里都有!
914篇文章
3402人已阅读

 六月初
六月初