echarts柱状图X轴数据拼接table关联实现效果
 六月初
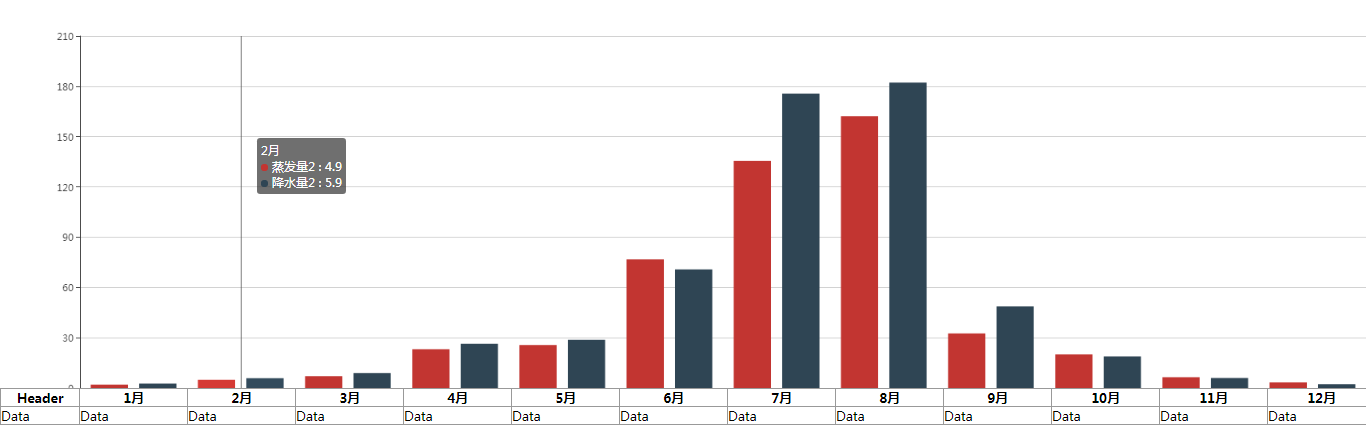
六月初echarts柱状图关联table表格实现隐藏X轴数据使用table表头来代替X轴的数据
最终效果图:
效果图完整代码:
<!DOCTYPE html>
<html>
	<head>
		<meta charset="UTF-8">
		<title></title>
		<meta name="viewport" content="width=device-width,minimum-scale=1.0,maximum-scale=1.0,user-scalable=no">
		<!-- <script src="https://cdn.staticfile.org/echarts/4.2.0-rc.2/echarts.min.js"></script> -->
		<script src="http://libs.baidu.com/jquery/2.0.0/jquery.min.js"></script>
		<script src="echarts.min.js"></script>
		<style>
			*{
				padding: 0;
				margin: 0;
			}
			table{
				border-spacing: 0;
				border-collapse: collapse;
				table-layout:fixed
			}
		</style>
		<script>
			$(function(){
				$("th").eq(0).css('width','98px')
				$("th").not(":first").width(parseInt(($("#test").width()-98)/12))
			})
		</script>
	</head>
	<body>
		<div id="test" style="height: 500px;width: 100%;"></div>
		<table width="100%" border="1" bordercolor="#999" cellspacing="0" cellpadding="0">
			<tr>
				<th>Header</th>
				<th>1月</th>
				<th>2月</th>
				<th>3月</th>
				<th>4月</th>
				<th>5月</th>
				<th>6月</th>
				<th>7月</th>
				<th>8月</th>
				<th>9月</th>
				<th>10月</th>
				<th>11月</th>
				<th>12月</th>
			</tr>
			<tr>
				<td>Data</td><td>Data</td><td>Data</td><td>Data</td><td>Data</td><td>Data</td><td>Data</td><td>Data</td><td>Data</td><td>Data</td><td>Data</td><td>Data</td><td>Data</td>
			</tr>
		</table>
		<script>
			var dom = document.getElementById('test');
			var myChart = echarts.init(dom);
			var app = {};
			option = null;
			option = {
				grid: {
					left: 100,
					right: 0,
					bottom: 0
				},
				tooltip: {
					trigger: 'axis'
				},
				// legend: {
				// 	data: lengthData
				// },
				calculable: true,
				xAxis: [{
					type: 'category',
					"show": false,
					data: ['1月', '2月', '3月', '4月', '5月', '6月', '7月', '8月', '9月', '10月', '11月', '12月']
				}],
				yAxis: [{
					type: 'value'
				}],
				series: [{
						name: '蒸发量2',
						type: 'bar',
						data: [2.0, 4.9, 7.0, 23.2, 25.6, 76.7, 135.6, 162.2, 32.6, 20.0, 6.4, 3.3],

					},
					{
						name: '降水量2',
						type: 'bar',
						data: [2.6, 5.9, 9.0, 26.4, 28.7, 70.7, 175.6, 182.2, 48.7, 18.8, 6.0, 2.3],

					}
				]
			};
			if (option && typeof option === "object") {
				myChart.setOption(option, true);
			}
		</script>
	</body>
</html>
关键点解析:
1、设置table-layout属性,避免table设置的宽度不能正常生效
table-layout:fixed2、设置tabel第一列为固定宽度,后面12个月所占的列等比宽度
3、 设置echarts距离左边为固定宽度,底部距离为零
grid: {
	left: 100,
	right: 0,
	bottom: 0
},
结语:简单的说就是设置了echarts距离左边的宽度等于表格中第一列的宽度,剩余12个月的宽度通过计算来等比设置。
 六月初字帖坊小程序
你想要的字帖模板及工具,这里都有!
六月初字帖坊小程序
你想要的字帖模板及工具,这里都有!
919篇文章
12615人已阅读